Chaos testing of an event-sourced application
07.04.2016
In this blog post I want to combine a couple of interesting topics around testing and learning about reactive, distributed applications.
Specifically I want to illustrate the usage scenarios and advantages of “chaos testing” with distributed applications written in Scala using Akka and the Eventuate event-sourcing framework.
Motivation
Building reactive, resilient, highly-available, distributed and what-not applications is one of the main focuses when planning new software architectures these days. There are a lot of frameworks that assist you in getting your feet wet. But just using an actor-based programming model (i.e. using Akka) does not make our application reactive and fault-tolerant by definition. Nor does encapsulating our application’s state in an event-sourced approach guarantee that our architecture is resilient when parts of the systems fail unexpectedly.
In order to really achieve these ambitious goals of a robust und reactive application, we have to make sure that we are using the utilized frameworks correctly and assemble our system’s components in an elastic and fault-tolerant fashion. Chaos testing is one great way to check and validate our application’s behavior when things go wrong - and we all know there is a lot that can go wrong, especially when building systems that rely on networking (and which system doesn’t…?).
Moreover, having the option to inspect your application’s behavior during failures in a sanitized testing environment has great potential for deeply understanding the inner system’s mechanisms and weaknesses.
This post will give you a quick tour of the possibilities you gain when instrumenting some tools (like docker) to have your application be chaos-tested.
Table of contents
Basics
First off, there are a few basics I want to mention real quick so we are all on the same page regarding the key topics this post is going to talk about. Of course this won’t be a fully-fledged deep introduction into all the discussed topics but rather focuses on giving you a rough idea what we are dealing with and to get you interested just enough to get going.
If you are already familiar with the basics you may jump directly into the real action.
Reactive applications
Yeah, there it is - the big word “reactive”. Every application is supposed to be reactive these days, and certainly a freshly built system should comply with the “reative” concepts. So what are these concepts?
The foundation of the “reactive” ideas are described in “The Reactive Manifesto” in all details. To summarize the thoughts, a “reactive” application is meant to be
Responsive
the application has to quickly answer to the requests the client, user or interface is generating
Resilient
even in case of failures the application is meant to respond by being highly available in all parts of the system
Elastic
the system has to dynamically adjust its utilized resources depending on the workload it is currently facing
Message driven
by using an asynchronous message-passing communication the application is supposed to ensure loose coupling, location transparency and isolation
All those four key concepts describe the properties of an application we are about to build a test setup for. Yeah, I know - it’s just a small example but we gotta start somewhere, right?
Event-sourcing
Event sourcing describes the concept that all changes to your application’s state is captured as a sequence of events. This includes the possibility to query the application state. Additionally we can use the event log to reconstruct and inspect past states. This concept is the foundation of the Eventuate framework which we are going to use for our test application.
Without going into too much detail here, Martin Fowler wrote a great article on event sourcing describing the concept with a small example of a business application.
Technologies
Below, we look at some of the basic building blocks of an example application we are going to chaos test further on.
Akka
Akka is the framework for actor-based programming on the JVM. It is heavily inspired by Erlang/OTP.
If you look on Akka’s landing page on http://akka.io you can see the framework’s focus is clearly on those of a reactive system we just described:
Akka is a toolkit and runtime for building highly concurrent, distributed, and resilient message-driven applications on the JVM.
So if we are going to believe what is said there, we are obviously picking the right tool for the job. Being message-driven by design and providing a sophisticated supervision model between actors, Akka’s claim seems to be justified as well.
Eventuate
As we said earlier we are focussing on event-sourced applications to achieve a truly reactive system architecture. Eventuate is an open-source framework developed by the RedBull Media House which we are using and testing in the following:
Eventuate is a toolkit for building distributed, highly-available and partition-tolerant event-sourced applications. It is written in Scala and built on top of Akka, a toolkit for building highly concurrent, distributed, and resilient message-driven applications on the JVM.
Example application
Most of the chaos testing setup I am describing in here was developed as part of the eventuate-chaos project that tests the Eventuate framework during several chaos setups. For that reason I will first describe one of the most relevant test scenarios to describe the basic possibilities of chaos testing.
In a future blog post I will extend the chaos testing to an small example application that may describe a more real-world scenario.
Operation-based counter CRDT
The application is a operation-based counter CRDT service that is distributed among three Eventuate locations (each represented by a separate node). The counter CRDT service is part of the Eventuate library itself. The persistence of the event-sourced services is driven by a Cassandra storage backend for each location.
Components
The application will basically consist of the following components:
- Location 1:
- CRDT counter service 1 (
L1) - Cassandra node 1 (
C1)
- CRDT counter service 1 (
- Location 2:
- CRDT counter service 2 (
L2) - Cassandra node 2 (
C2)
- CRDT counter service 2 (
- Location 3:
- CRDT counter service 3 (
L3) - Cassandra node 3 (
C3)
- CRDT counter service 3 (
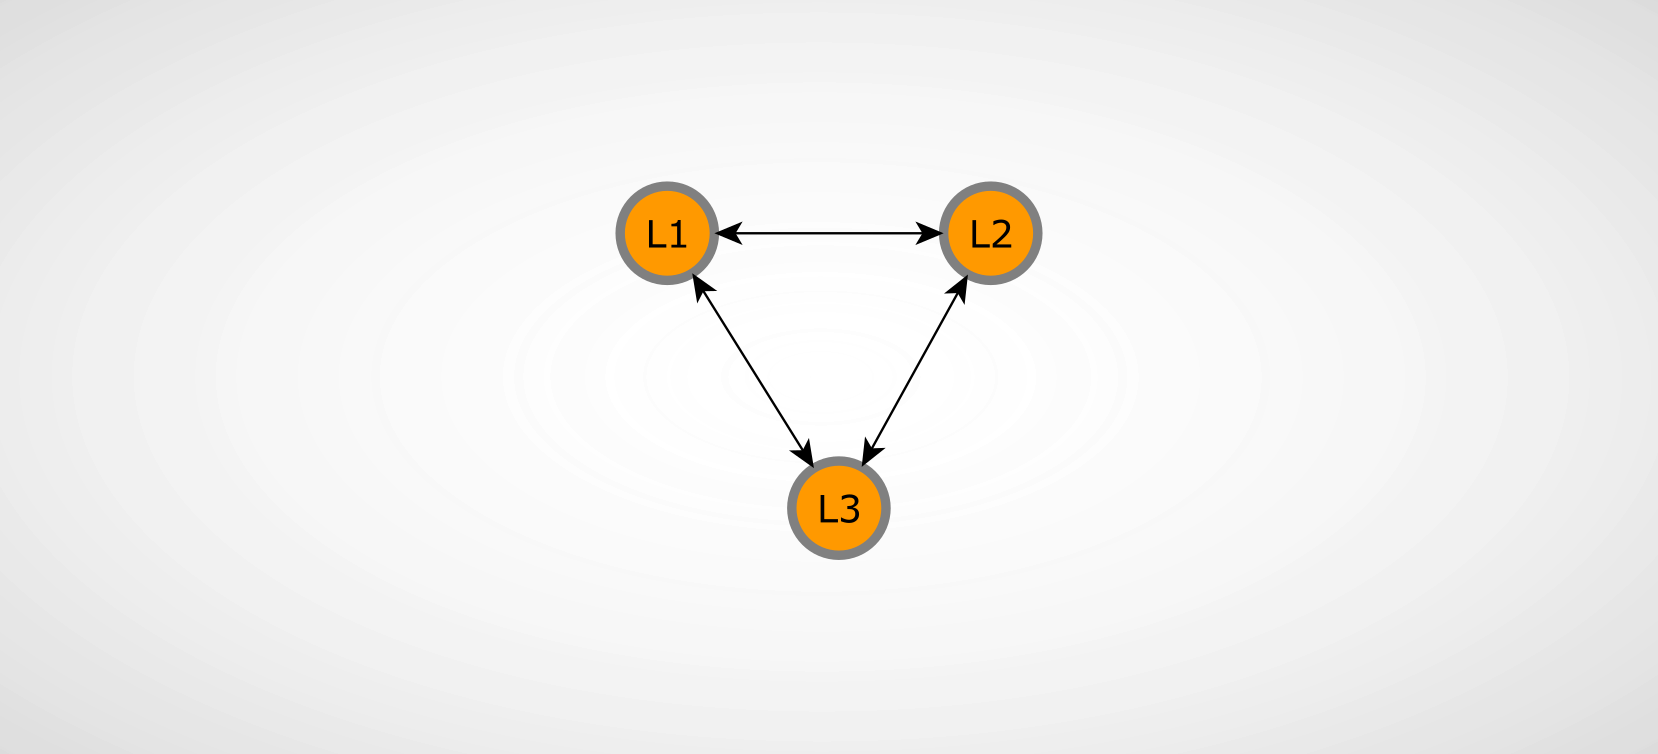
Application overview
application overview
The illustration above describes the relations between the participating nodes we are working with in this example. The connections between the shown nodes also describe the Eventuate replication connections. These form a replication network of event-sourced messages that are distributed between the connected nodes. The Eventuate documentation explains the details of replicated state between event-sourced actors under the event collaboration.
This network between the participating nodes is central to the test setup we are going to built for chaos testing - more information on that in the following section on blockade setup. It is also worth noting that we are describing a cyclic replication network in this example meaning every one of the three Eventuate application nodes is connected with each other. The eventuate-chaos project includes a test scenario with an acyclic replication network as well.
Failure scenarios
There are numerous kinds of failures our system has to deal with when running in production in larger scale. So how can we categorize these failures and how are we going to test them?
Network failures
This is the most important kind of failure that can happen particularly in distributed systems: network failures. If we are going to built a reactive and therefore resilient system we explicitly want to be “distributed” e.g. across different data centers. As soon as any of the nodes described above are running on different machines/systems that are connected via the network, we have to expect all kinds of failures in our network which are interfering with the communication between our application parts/nodes.
Partitions
During a network partition one or multiple nodes are partitioned from the rest of the network so that packets won’t reach the target host. This might be a misconfigured router, restrictive firewall rules, DNS errors and errors on the transport layer in general.
Delays
Caused by too much traffic on the wire or other reasons the packets we are sending between our nodes might get delayed which ends up in discarded packets and timeouts of requests.
Packet loss
Moreover we might have a temporarily unstable connection that sporadically drops packets during the communication.
Node failures
Another family of errors we may encounter are node failures - every time one host, a virtual machine or maybe even a docker container crashes or freezes. A host that runs out of memory and behaves unpredictable for that reason is an example. The same failure category is a node that cannot write to disk anymore because of insufficient disk space.
Application errors
These are the more usual errors like some kind of internal exception in the application code. Usually we are able to test those failures with unit, integration and performance tests without inspecting the system architecture itself.
Chaos testing
As described above there are different types of failure we may encounter in our distributed application. The chaos testing that we want to focus on in this post is especially targeting the network and node failures. In a nutshell we are going to build a virtual test environment and introduce random network and node errors while running the system.
In order to have an easy and fast testing cycle we are using some tools that I want to describe in a few words.
Tools
So, that’s enough theory I think - let’s get to the actual tools we are going to use and the test setup infrastructure itself.
Docker
You have probably heard of Docker already. Docker is a container engine that allows you to package and run applications in a hardware-agnostic and platform-agnostic fashion - often called like somewhat lightweight virtual machines.
Blockade
Blockade is our primary work-horse of chaos testing - the documentation says about itself:
Blockade is a utility for testing network failures and partitions in distributed applications. Blockade uses Docker containers to run application processes and manages the network from the host system to create various failure scenarios.
A common use is to run a distributed application such as a database or cluster and create network partitions, then observe the behavior of the nodes. For example in a leader election system, you could partition the leader away from the other nodes and ensure that the leader steps down and that another node emerges as leader.
Blockade is a python library that works very similar to [docker compose][compose], as you can describe an application setup of several different containers using a YAML configuration file. The library interacts with docker using its python API (docker-py) and interferes with the docker network using iptables and tc.
Vagrant / virtualbox
In case you are running Mac OS you will need some kind of virtualization like Vagrant/Virtualbox because Docker doesn’t run natively on Mac.
There you have it - this is all we need!
Test setup
I wasn’t too honest there, of course we need some preparation on our application side as well - specifically:
- the application code packaged in a docker image(s)
- optional supplementary docker images (i.e. cassandra, nginx …)
- test routines that generate load on the appplication code (i.e. some kind of performance/integration tests)
- optionally some validation functions that may automatically test the application state on validity
Docker images
For our test application we need to have three different docker images:
- CRDT counter service application
- Cassandra
- DNS discovery container (
dnsdock)
Cassandra
The cassandra database is the easiest one: we can use the official cassandra docker images hosted on https://docker.io (we are using version 2.2.3):
$ docker pull cassandra:2.2.3CRDT counter service
There are numerous ways how you can package your Scala application in a docker image. The most straightforward way is to use a base image with a Java 8 JVM runtime and include the application artifact (i.e. packaged in a jar or tar.gz) via the Dockerfile. I went for the official OpenJDK image to build the custom application images. You can also use an Oracle Java 8 image but you will have to bootstrap one by yourself or use one of the unofficial images. In case you are using SBT to build your application you could facilitate one of the sbt docker plugins as well (i.e. sbt-native-packager, sbt-docker).
# file: Dockerfile
#
# OpenJDK 8 base image
FROM java:8
MAINTAINER Gregor Uhlenheuer <[email protected]>

# include the packaged application into the image itself
#  built via `sbt universal:packageZipTarball`
ADD ./application.tgz /app

WORKDIR /app

# port 8880 which the REST interface is listening on
EXPOSE 8880

ENTRYPOINT ["java", "-cp", "."]
CMD ["com.rbmhtechnology.eventuate.chaos.ChaosCounterCassandra"]
As you can see we included the application package tarball (application.tgz) into the image itself. You may also mount a directory from your host system and include the application artifacts from there (which is what we did in eventuate-chaos originally). This basically depends on your development and testing workflow and how often you intend to test a new snapshot of the application.
DNS discovery via dnsdock
In case your application setup requires your nodes to be bi-directionally connected with each other you have to identify your containers via DNS. In simpler setups it may even be sufficient to use docker links to establish connections. So you don’t have to lift a heavy DNS setup on your host machine the solution I like the most is to supply the DNS service as a docker container itself. By asking google you will find a couple of possible solutions like skydock and others - I found dnsdock by tonistiigi to be the simplest one:
$ docker pull tonistiigi/dnsdockDepending on your host setup (natively on Linux or virtualized via Virtualbox) you have to start the dnsdock image and have it listen on your docker0 network interface on DNS port 53. This can be achieved with something along the following lines:
# determine the docker0 interface
$ ip li show docker0
4: docker0: <NO-CARRIER,BROADCAST,MULTICAST,UP> mtu 1500 qdisc noqueue state DOWN group default
    inet 172.17.0.1/16 scope global docker0

# start the dnsdock container
$ docker run -d --name dnsdock -p 172.17.0.1:53:53/udp -v /run/docker.sock:/run/docker.sock tonistiigi/dnsdock
The dnsdock container now listens on the docker socket interface (/run/docker.sock) and dynamically registers names to all running containers (and un-registers on termination) using the following default naming scheme:
<container-name>.<image-name>.dockerAccordingly, the first container of the test application location1 would be identified as location1.test-app.docker.
Image overview
Now we can build the images that are going to be reused for the test runs themselves:
$ docker build -t agido/test-app DockerfileYou should be now able to see your docker images ready to be started via docker images:
$ docker images
REPOSITORY           TAG          IMAGE ID          CREATED           VIRTUAL SIZE
agido/test-app       latest       a8d98e1f1618      2 hours ago       852.3 MB
java                 8            9afbe4c3ddc8      4 weeks ago       642.3 MB
cassandra            2.2.3        f446271ec5e3      9 weeks ago       365 MB
tonistiigi/dnsdock   latest       1130c820c470      5 months ago      632.9 MB
Blockade setup
That’s it - we have all the building blocks of the chaos test scenario prepared. Now we just have to define the test cluster in a Blockade YAML configuration file. The blockade.yml configuration file of our test application looks like the following:
containers:

  c1:
    image: cassandra:2.2.3
    container_name: c1
    expose: [9042]

  c2:
    image: cassandra:2.2.3
    container_name: c2
    expose: [9042]

  c3:
    image: cassandra:2.2.3
    container_name: c3
    expose: [9042]

  location1:
    image: agido/test-app
    container_name: location1
    # we are passing the other locations' hostnames via command line arguments
    # these are used to dynamically construct the replicatio network among the locations
    command: ["com.rbmhtechnology.eventuate.chaos.ChaosCounterCassandra location1 location2.sbt.docker location3.sbt.docker"]
    ports:
      10001: 8080
    links: ["c3"]
    environment:
      HOSTNAME: "location1.sbt.docker"
      CASSANDRA_NODES: "c1.cassandra.docker"

  location2:
    image: agido/test-app
    container_name: location2
    command: ["com.rbmhtechnology.eventuate.chaos.ChaosCounterCassandra location2 location1.sbt.docker location3.sbt.docker"]
    ports:
      10002: 8080
    links: ["c3"]
    environment:
      HOSTNAME: "location2.sbt.docker"
      CASSANDRA_NODES: "c2.cassandra.docker"

  location3:
    image: agido/test-app
    container_name: location3
    command: ["com.rbmhtechnology.eventuate.chaos.ChaosCounterCassandra location3 location1.sbt.docker location2.sbt.docker"]
    ports:
      10003: 8080
    links: ["c3"]
    environment:
      HOSTNAME: "location3.sbt.docker"
      CASSANDRA_NODES: "c3.cassandra.docker"
Most of the configuration should be rather self-explanatory - we are defining a total of 6 docker containers while specifying a few additional properties like environment variables, host volumes to mount or ports that should be exposed to our host system. Please consult the [blockade documentation][blockade_doc] for further detailed explanations regarding those and other options.
Worth noting are the exposed ports 10001, 10002 and 10003 that map to the container internal port 8880 of location1, location2 and location3 respectively. We will use these ports to interface with the TCP endpoint of the application from the host system.
Testing
The test procedure may begin now - we are going to fire up the cluster containing the configured docker containers and subsequently trigger various failures in order to inspect the application’s behavior.
Bringing up the cluster
Now we can easily start the test cluster defined in the blockade.yml configuration by invoking blockade up.
$ sudo blockade upPlease note you will need administrative permissions (i.e.
sudo) as the blockade toolkit requires access toiptablesandtc:
Inspecting the cluster status
In order to see what the cluster’s containers are currently up to, you can use blockade status:
$ sudo blockade status
NODE            CONTAINER ID    STATUS  IP              NETWORK    PARTITION
c1              56e23b012d17    UP      172.17.0.7      NORMAL
c2              4e013d29bbf7    UP      172.17.0.6      NORMAL
c3              b5b6e6927b00    UP      172.17.0.8      NORMAL
location1       767dd13066e5    UP      172.17.0.4      NORMAL
location2       983a7e8e7fe8    UP      172.17.0.3      NORMAL
location3       e296f72f7119    UP      172.17.0.5      NORMAL
Partitioning of nodes
Let’s say we want to partition the application nodes (location1, location2 and location3) from the rest of the cluster to see how the application behaves when it looses access to its storage backend. Blockade’s partition command accepts a number of comma-separated nodes that specify one or many partitions to generate:
$ sudo blockade partition location1,location2,location3
$ sudo blockade status
NODE            CONTAINER ID    STATUS  IP              NETWORK    PARTITION
c1               56e23b012d17    UP      172.17.0.7      NORMAL     2
c2               4e013d29bbf7    UP      172.17.0.6      NORMAL     2
c3               b5b6e6927b00    UP      172.17.0.8      NORMAL     2
location1        767dd13066e5    UP      172.17.0.4      NORMAL     1
location2        983a7e8e7fe8    UP      172.17.0.3      NORMAL     1
location3 e296f72f7119 UP 172.17.0.5 NORMAL 1You may also introduce a random partition so that blockade chooses the nodes to partition by itself:
$ sudo blockade partition --random
$ sudo blockade status
NODE            CONTAINER ID    STATUS  IP              NETWORK    PARTITION
c1               56e23b012d17    UP      172.17.0.7      NORMAL     2
c2               4e013d29bbf7    UP      172.17.0.6      NORMAL     2
c3               b5b6e6927b00    UP      172.17.0.8      NORMAL     2
location1        767dd13066e5    UP      172.17.0.4      NORMAL     1
location2        983a7e8e7fe8    UP      172.17.0.3      NORMAL     2
location3 e296f72f7119 UP 172.17.0.5 NORMAL 2Automated testing
Now you can inspect your application’s behavior and its logs (i.e. via docker logs location1) if you inject various failures by hand. But as blockade can be included from python script as a library as well, you can write automated test scenarios very easily.
Python script example
#!/usr/bin/env python

import blockade.cli

ITERATIONS = 100
DELAY = 15

if __name__ == '__main__':
    # load blockade environment
    config = blockade.cli.load_config('blockade.yml')
    blk = blockade.cli.get_blockade(config)

    # start application
    # ...
    # start test suite
    # ...

    for i in xrange(ITERATIONS):
        partition = blk.random_partition()

        time.sleep(DELAY)

    blk.join()
    blk.fast(None, None)
Bash script example
If you are not too familiar with python you can also write your test script with bash which might look somewhat like the following:
#!/bin/bash -eu

readonly DELAY=${DELAY:-15}
readonly ITERATIONS=${ITERATIONS:-10}

# startup containers
sudo blockade up

# wait for application to startup
./wait-startup.sh

# start (integration) test suite
sbt gatling:test &

IDX=0
while [[ $IDX -lt $ITERATIONS ]]; do
    IDX=$(( $IDX + 1 ))

    echo "[$IDX/$ITERATIONS] Inject random network failure..."
    sudo blockade partition --random && sudo blockade status

    echo "Waiting for $DELAY sec..."
    sleep $DELAY
done

# stop tests (if necessary)
kill %1 || :

# clear partitions/failures
sudo blockade join
sudo blockade fast --all
The dummy script above is just a simple example that injects a random partition among the configured nodes and waits 15 seconds between each iteration. After the chaos test run finished it makes sense for automated testing to validate the application’s internal state.
Example output
The output of a test run of the eventuate-chaos project will look like the following. As you can see it indicates that the three participating nodes processed 6631 counter operations and finally converged to the exact same counter value even though the nodes were partitioned from each other a couple of times.
scenarios/counter $ sudo ../../crdt-counter-partitions.py -i 5 --interval 0.001
Chaos iterations: 5
Request interval: 0.001 sec
Nodes:
  location-1
  location-2
  location-3
Waiting for 3 nodes to be up and running...
Starting requests...
Partition 1: location-1
Partition 2: location-3
Partition 3: location-2
--------------------
Partition 1: location-3, location-1
Partition 2: location-2
--------------------
Partition 1: location-3
Partition 2: location-1
Partition 3: location-2
--------------------
Cluster joined
--------------------
Partition 1: location-3
Partition 2: location-2, location-1
--------------------
Joining cluster - waiting 30 seconds to settle...
Processed 6631 requests in the meantime
Counter value (9037) matches up correctly
Final words
I hope I could give you a good impression on what you can accomplish when you put chaos-testing in your software development and testing toolbelt and that orchestrating such a setup is no rocket science at all.
extend your testing setup by proving that your application meets the reactive concepts
broaden your knowledge about your application’s behavior under chaotic circumstances
build an easy-to-deploy docker test setup of your application stack
That’s it for the first part on chaos testing - stay tuned for the next post when we look into chaos testing a real application and investigating into some more event-sourcing specific topics.